|
Tutorial on Interpretation of PROGNOS Output
Follow this tutorial to see how to interpret the output of your PROGNOS search.
- For this tutorial, start by opening the output from the sample parameters used in the PROGNOS Input Form tutorial in a new window so you can follow along
by clicking here.
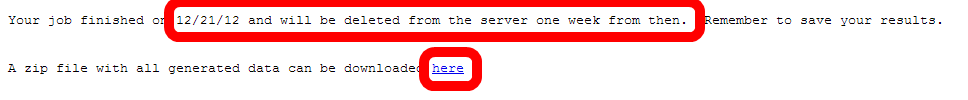
- Your results will remain stored on our servers for one week after they are completed. Please make sure to download and save them before that expires.
This can be accomplished by saving the ZIP file with all results provided in the link.
- The full output of all sites matching the PROGNOS search parameters contains more information than is useful to the average user.
If you would like to use this file for other purposes, such as generating novel ranking algorithms, see Step 11.
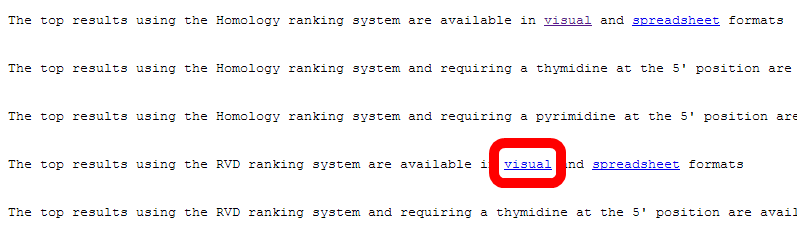
- The top rankings using the different PROGNOS algorithms are all available on this main summary page.
For this tutorial, we will look in depth at the rankings by the "RVDs" algorithm.
In the window where you have the summary page open, click on the link to view the visual format of the results.
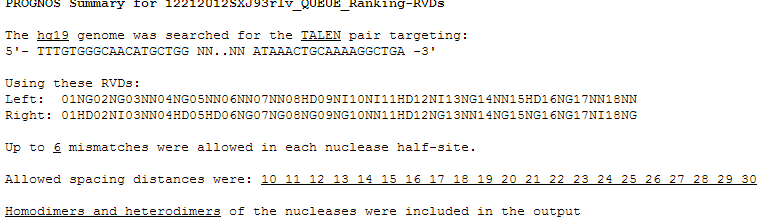
- At the top of the page is a summary of what the search parameters were.
This includes the genome, the target site, the RVDs (for TALENs only), the maxmimum number of mismatches, allowed spacer lengths,
and whether or not to search for homodimeric sites.
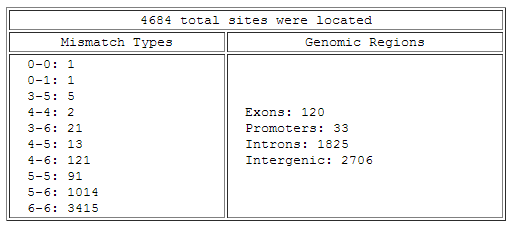
- Next is a summary of all the sites that were found in the genome using the given search parameters.
For "Mismatch Types", each is described as the number of sites occuring with the given number of mismatches in each of the half-sites.
For example, "3-6: 21" means that there were twenty-one sites with three mismatches in one half-site and six mismatches in the other.
"Genomic Regions" list the total number of sites found in exons of genes, introns of genes, promotors (the 1000 bp upstream of the transcription start site),
and intergenic sequence lying between annotated genes.
- Next is a summary of what the primer design parameters were.
This includes how much flanking sequence was used to design them, the target melting temperature, and the separation distances between cleavage bands.

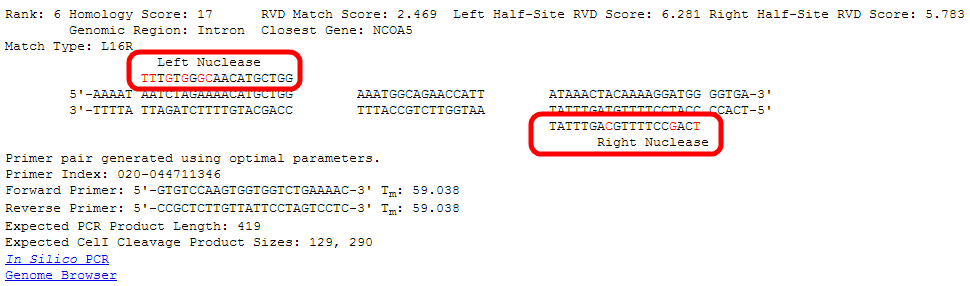
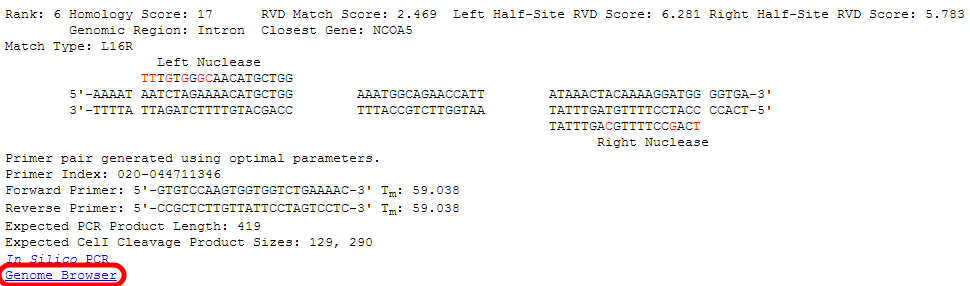
- Next are detailed information about each of the top-ranked sites.
For this tutorial, we will take a close look at the site ranked sixth by the RVDs algorithm.
Rankings are given from low to high, so rank number 1 is the most likely predicted off-target site.
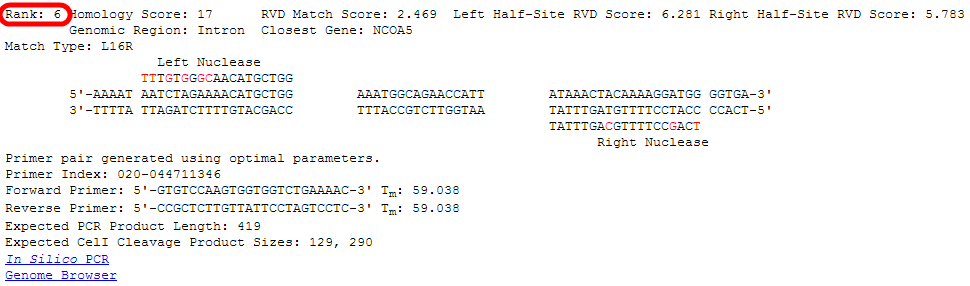
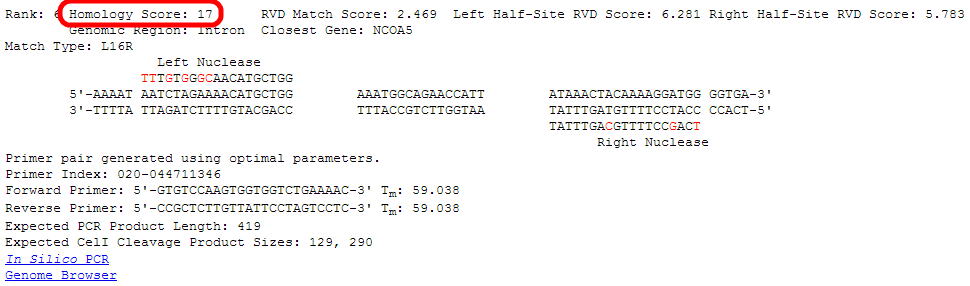
Even though these entries are ranked by the "RVDs" algorithm, the "Homology" score is still given as a reference.
Higher homology scores indicate a more likely off-target site.
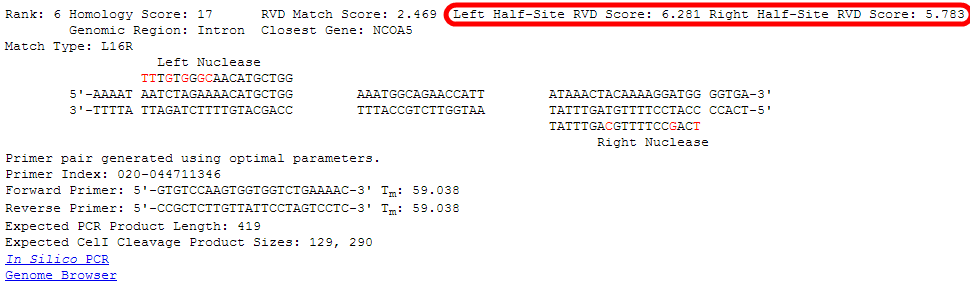
The score for the full length target site (left plus right) is shown.
Lower RVD scores indicate a more likely off-target site.
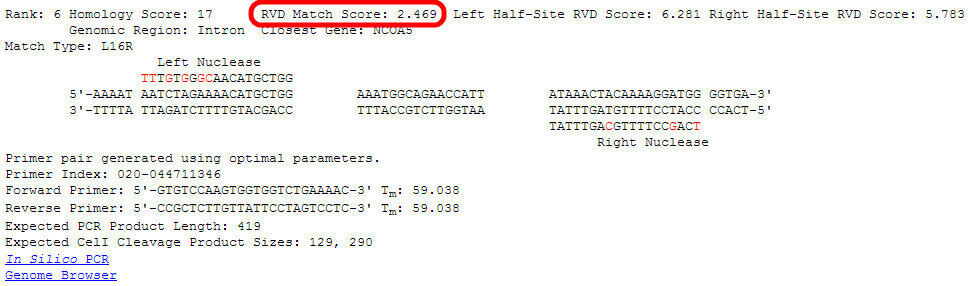
The individual scores for each half-site are shown. These are combined to make the full RVD Match Score according to the RVDs algorithm
Lower RVD scores indicate a more likely off-target site.
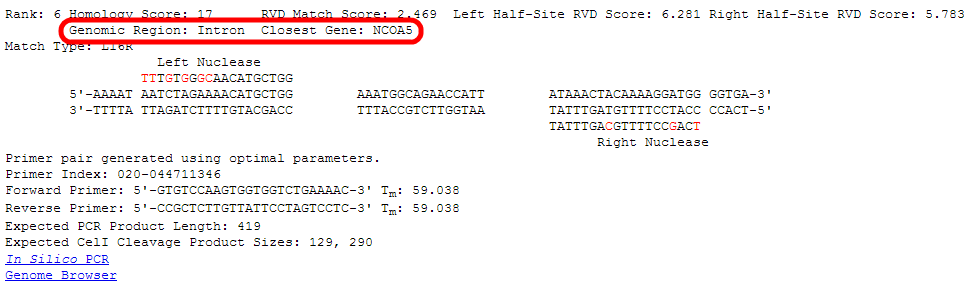
The closest gene to the site according to the RefSeq database is listed along with what genomic region (Exon/Intron/Promoter/Intergenic sequence) the site is in.
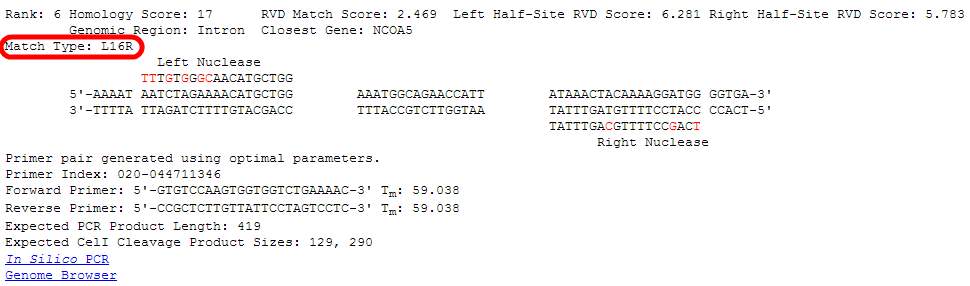
The "Match Type" shows the orientation of the nucleases at this site and the length of the spacer sequence in between.
In this case, "L16R" indicates that the left nuclease (as was entered in the search) is on the left side of this target, the two half-sites
are separated by a spacer of length 16 base pairs, and the right nuclease (as was entered in the search) is on the right side of this target.
The nucleases can be in other orientations, such as Right-Left, or Left-Left and Right-Right in the case of homodimeric sites.
Both strands of the genomic DNA at this potential off-target site are shown.
Flanking bases, the left half-site, the spacer sequence, the right right-site, and additional flanking bases are displayed.
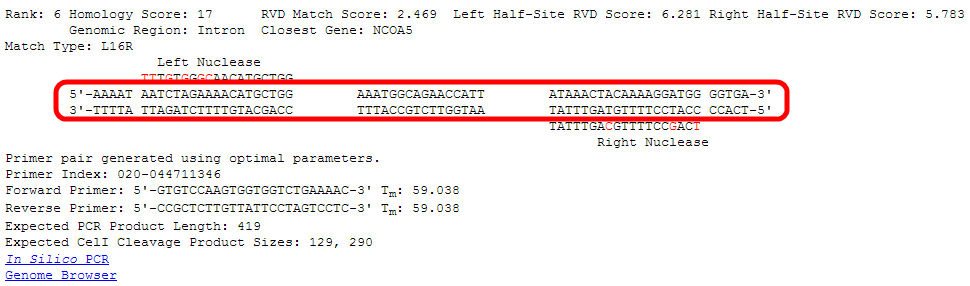
The intended targets of the nuclease at each half-site are shown. Letters highlighted in red indicate a mismatch relative to this potential off-target site.
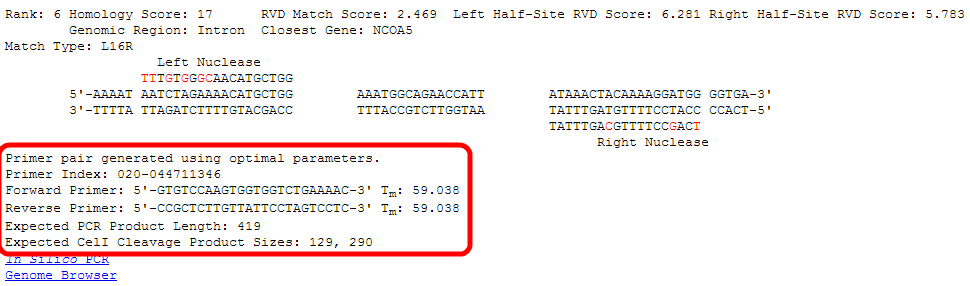
Information about the primers generated to PCR amplify this potential off-target site are given.
The first line indicates whether optimal or sub-optimal design parameters were used to generate this primer pair.
The next line gives a unique index to this pair of primers. The index is related to the genomic location, in this case: near position 44711346 on chromosome 20.
The next two lines give the sequence of the forward and reverse primers and their predicted melting temperatures. See step 9 for the Primer Order Form.
For aiding confirmation of the PCR product and Surveyor/T7E1/CelI assays, the expected product length and cleavage product sizes are given.
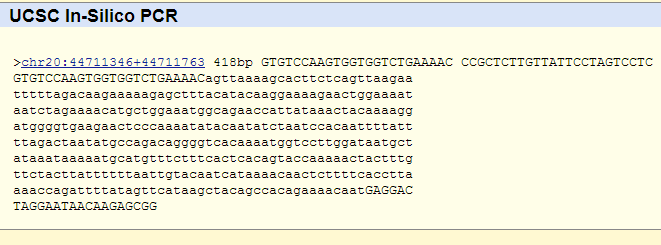
Following this link to the UCSC in silico PCR website will allow you to see if these primers are expected to make a unique product.
It is possible, although very unlikely, that there is another region of high homology in the genome that the primers may be able to amplify as well.
We personally do not use this feature since the rate that this occurs is so low, but it is available for users who wish to use it to double check the primers.
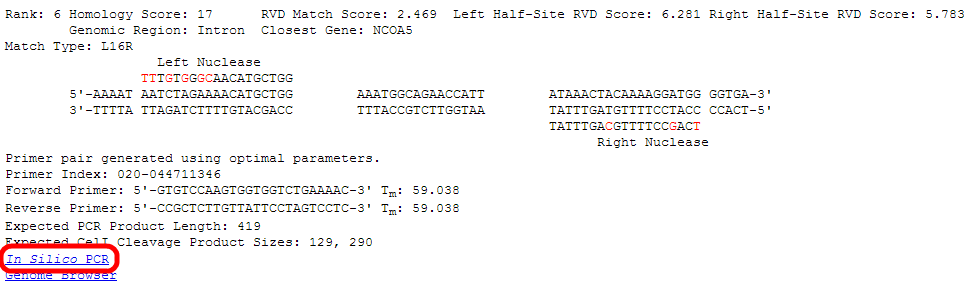
For this primer pair, the only expected amplification site is the intended amplicon in chromosome 20.
Following thisk link to the UCSC Genome Browser will allow you to see the genomic features at this potential off-target site.
- At the bottom of the page is a listing of all the primers that can be copied and pasted into an order form.
Highlight all of the primers you would want to order, right-click with your mouse, and press "Copy".
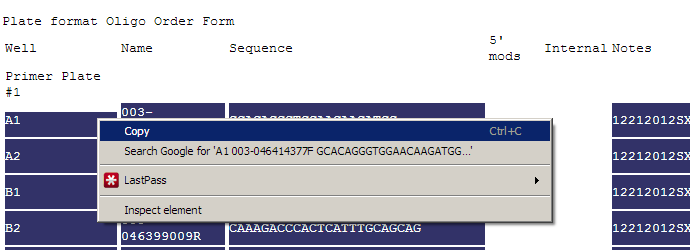
Download the Oligo Plate Order Form from Operon.
Open the order form in Microsoft Excel, right-click in the cell with the text "A1", select "Paste Special".
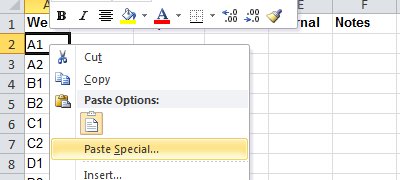
Select the "Text" option.
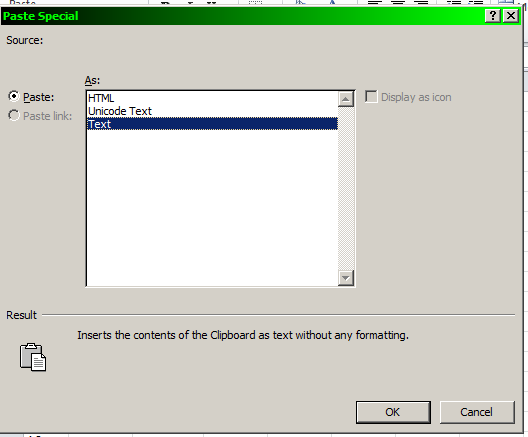
This form can now be uploaded directly to the Operon website.
Using the discount code "Plate8", oligos can be ordered from Operon at 8 cents per base as long as there are a minimum of 48 oligos in the plate order.
We typically order the primers normalized to 10 uM in 10 mM Tris.
- More details about the individual off-target sites are available in spreadsheet format.
For this tutorial, we will look in depth at the rankings by the "RVDs" algorithm.
In the window where you have the summary page open, click on the link to view the spreadsheet format of the results.
Depending on your browser, this may open up the file in Excel, or take you to a webpage full of seemingly random text.
If your browser takes you to a page full of text, then right-click on the link, select "Save Link As", and open the file in Excel.
This file contains all of the information provided in the visual output (except that mismatches are lower case instead of written in red) as well as the amplicon sequences.
- Details about the full output:
If you are an average user, this information will not be useful to you.
However, if you are interested in developing your own scripts and ranking algorithms to process this output, here is the description.
It is in TAB separated format, so if you save the file you can open it in excel as a TAB separated file.
These data are unsorted and each line represents a potential off-target site.
In each line, the first entry contains the chromosome, the chromosome location, the spacer length, and the orientation of the nucleases, all separated by colons.
For the orientation of the nucleases, 0 corresponds to Left - Right, 1 to Right - Left, 2 to Left - Left, and 3 to Right - Right.
The second entry contains the full sequence of the nuclease binding site including the left half-site, the spacer sequence, and the right half-site.
The third and fourth entries are the number of mismatches in the left and right half-sites respectively.
The fifth entry is the flanking sequence in the genome 5' of the nuclease target site.
The sixth entry is the flanking sequence in the genome 3' of the nuclease target site.
The seventh and eigth entries are the lengths of the left and right half-sites respectively.
The ninth entry defines what genomic region the site is in: 0-exon, 1-Promoter, 2-Intron, 3-Intergenic.
The tenth entry is the sequence of the left half-site with mismatches in lowercase.
The eleventh entry is the sequence of the spacer, all in lowercase.
The twelfth entry is the sequence of the right half-site (as it appears on the top/positive strand) with mismatches in lowercase.
The thirteenth entry is the name of the closest gene in the RefSeq database for that genome.
In the window where you have the summary page open, click on the link to view the spreadsheet format of the results.
Depending on your browser, this may open up the file in Excel, or take you to a webpage full of seemingly random text.
If your browser takes you to a page full of text, then right-click on the link, select "Save Link As", and open the file in Excel.
This file contains all of the information provided in the visual output (except that mismatches are lower case instead of written in red) as well as the amplicon sequences.
|